
New FluCov Dashboard offers a clear view on the circulation since 2019 of influenza and COVID-19 worldwide
The emergence of SARS-CoV-2 in 2019 had a major impact on the global circulation of respiratory viruses, including influenza. In order to understand the impact of SARS-CoV-2 on influenza activity worldwide, the new FluCov Dashboard, launched by Nivel, offers you a clear view of the current and past circulation of both viruses, in a wide range of countries (22) all over the world. In doing so, the Dashboard presents important data for preventive strategies, worldwide as well as at a country-level. In this way, we aim to improve public health on a global and national level.
Real-time weekly surveillance data on SARS-CoV-2 and influenza viruses are downloaded for a wide representative sample of countries in terms of the geography and levels of development .
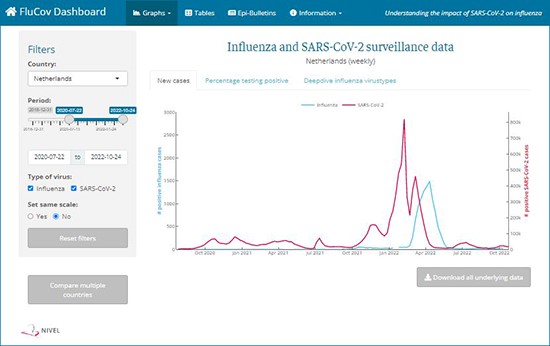
The FluCov Dashboard: By selecting one or several countries, periods and viruses, one obtains a presentation of 'new cases', 'percentage testing positive' and a 'deep-dive into the circulating influenza viruses'.
Real-time data to support prevention and control measures
The dashboard responds to a global need to document and communicate the impact of the SARS-CoV-2 pandemic on influenza activity. We provide information on the circulation of the two viruses at a glance, information that can be used to promptly understand the epidemiological situation in 22 countries. These insights support prevention and control measures and efforts to counter possible increases in virus activity.
About the FluCov Project
The FluCov project was started to document and communicate about the impact of the SARS-CoV-2 pandemic on influenza activity. The project is funded by Sanofi via a collaborative agreement with Nivel. FluCov aims are threefold: 1) to document and communicate the impact of the SARS-CoV-2 pandemic on influenza activity; 2) to document and communicate about measures to prevent and control influenza in the coming years (e.g. by vaccination); 3) to model and provide influenza activity scenarios in the Southern (2022 winter) and Northern Hemisphere (2022/23 winter).
The FluCov Dashboard is one of the project deliverables, alongside the Epi-Bulletins, Survey results, abstracts and reports. All of these can be accessed at Nivel FluCov website.